Home > Project Management - Enterprise
Emotional Footprint Awards 2024
Project Management - Enterprise
SoftwareReviews names Teamwork, Basecamp, Asana, and Confluence as Project Management - Enterprise Emotional Footprint Award Winners.
View Category
Project Management - Enterprise
Emotional Footprint Awards
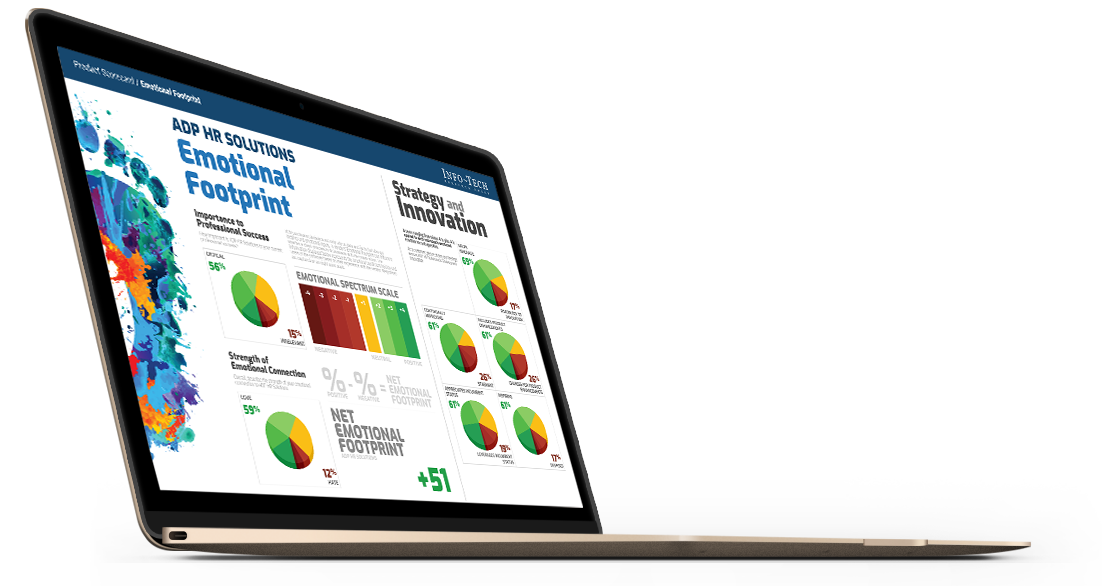
SoftwareReviews Emotional Footprint Awards evaluate and rank products based on emotional response ratings from IT and business professionals. Using our Emotional Footprint methodology, we aggregate emotional footprint scores across 26 dimensions of the vendor-client relationship and product effectiveness, creating a powerful indicator of overall user feeling toward the vendor and product.
Emotional Footprint Awards are proudly founded in 100% user review data and are free of traditional “magical” components such as market presence and analyst opinion, which are opaque in nature and may be influenced by vendor pressure, financial or otherwise.
Read The In-Depth Report
See how each vendor stacks up across each of the 26 dimensions and our thorough evaluation of vendor capabilities, product features, and overall satisfaction.
30+ pages


Measuring Emotional Footprint
Emotional Footprint is scored using our “Net Emotional Footprint” Index. This index tracks responses across 26 dimensions of emotional footprint that span 5 categories: Purchasing, Service Experience, Product Impact, Vendor Strategy, and Conflict Resolution. Then, the following calculation is done across this index:
% of Positive Reviews - % of Negative Reviews
For clarity, the total percentage of positive, neutral, and negative ratings is shown for each vendor as well.
Emotional Footprint Leaders
Basecamp
Basecamp
Basecamp’s unique blend of tools is everything any team needs to stay on the same page about whatever they’re working on.
9.3
CX Score
CX
Score
+95
Net Emotional Footprint
Net Emotional
Footprint
89
Value Index
VALUE INDEX
Summary.
Long description.
Structure.
Chart graphic.

173Reviews
Teamwork.com
Teamwork
Teamwork Projects takes care of the details so you and your team can focus on the big picture.
9.3
CX Score
CX
Score
+95
Net Emotional Footprint
Net Emotional
Footprint
89
Value Index
VALUE INDEX
Summary.
Long description.
Structure.
Chart graphic.

148Reviews
Atlassian
Confluence
Confluence is your remote-friendly team workspace where knowledge and collaboration meet. Confluence turns conversations into action built for lasting knowledge so you never lose great ideas or context in a transient notification or chat. From marketing and sales to development and operations, Confluence has solutions for every type of team and project to get your team doing the real work right away.
9.3
CX Score
CX
Score
+93
Net Emotional Footprint
Net Emotional
Footprint
90
Value Index
VALUE INDEX
Summary.
Long description.
Structure.
Chart graphic.

125Reviews
Asana
Asana
With tasks, projects, conversations and dashboards, Asana enables teams to move work from start to finish.
9.3
CX Score
CX
Score
+94
Net Emotional Footprint
Net Emotional
Footprint
89
Value Index
VALUE INDEX
Summary.
Long description.
Structure.
Chart graphic.

701Reviews
Other Evaluated Vendors
Atlassian
Trello
Trello lets you work more collaboratively and get more done. Trello’s boards, lists, and cards enable you to organize and prioritize your projects in a fun, flexible and rewarding way.
9.2
CX Score
CX
Score
+93
Net Emotional Footprint
Net Emotional
Footprint
89
Value Index
VALUE INDEX
Summary.
Long description.
Structure.
Chart graphic.
566Reviews
ClickUp
ClickUp
Build ClickUp into your own mission control center - small team or large team, simple workflows or complex workflows. One platform for everything. Bring everything together in one centralized place to manage all your productivity needs and track progress with custom Dashboards.
9.2
CX Score
CX
Score
+93
Net Emotional Footprint
Net Emotional
Footprint
88
Value Index
VALUE INDEX
Summary.
Long description.
Structure.
Chart graphic.
156Reviews
Wrike
Wrike
Wrike combines project management with a real-time workspace for collaboration, discussion, and document sharing. It provides online project management software to set up priorities and align your team to work faster and smarter across your organization.
9.2
CX Score
CX
Score
+94
Net Emotional Footprint
Net Emotional
Footprint
87
Value Index
VALUE INDEX
Summary.
Long description.
Structure.
Chart graphic.
341Reviews
Atlassian
Jira
JIRA Software is built for every member of your software team to plan, track, and release great software.
9.2
CX Score
CX
Score
+92
Net Emotional Footprint
Net Emotional
Footprint
88
Value Index
VALUE INDEX
Summary.
Long description.
Structure.
Chart graphic.
512Reviews
Adobe Systems
Adobe Workfront
Our PPM Software gives management the tools they need to prioritize and get their team working on the tasks that matter most, making the most significant impact on your business.
9.2
CX Score
CX
Score
+95
Net Emotional Footprint
Net Emotional
Footprint
86
Value Index
VALUE INDEX
Summary.
Long description.
Structure.
Chart graphic.
69Reviews
Airtable
Airtable
Airtable is a flexible solution that can fit any workflow. Relate data across teams. Create real-time reports and analytics.
9.1
CX Score
CX
Score
+94
Net Emotional Footprint
Net Emotional
Footprint
86
Value Index
VALUE INDEX
Summary.
Long description.
Structure.
Chart graphic.
96Reviews
monday.com
monday.com
A tool that works for you, Not the other way around. monday.com is a tool that transforms the way teams work together. Our mission is to help teams build a culture of transparency, empowering everyone to achieve more and be happier at work. We're obsessed with building an excellent product, and our goal is to create a tool that people will love to use—one that’s fast, beautiful, responsive, and makes your life easier.
9.1
CX Score
CX
Score
+93
Net Emotional Footprint
Net Emotional
Footprint
86
Value Index
VALUE INDEX
Summary.
Long description.
Structure.
Chart graphic.
223Reviews
Smartsheet
Smartsheet
Smartsheet is the best way to plan, track, automate, and report on work, enabling you to move from idea to impact — fast.
9.1
CX Score
CX
Score
+92
Net Emotional Footprint
Net Emotional
Footprint
87
Value Index
VALUE INDEX
Summary.
Long description.
Structure.
Chart graphic.
177Reviews
Zoho
Zoho Projects
Plan, track, and collaborate using the preferred online project management software of more than a million businesses.
8.9
CX Score
CX
Score
+88
Net Emotional Footprint
Net Emotional
Footprint
86
Value Index
VALUE INDEX
Summary.
Long description.
Structure.
Chart graphic.
79Reviews
Microsoft Corporation
Microsoft Project
Stay organized, focused, and in charge. Tackle anything from small projects to large initiatives. You may or may not be a project manager, but now you can be the boss of any project with a powerful, easy-to-use app.
8.8
CX Score
CX
Score
+88
Net Emotional Footprint
Net Emotional
Footprint
85
Value Index
VALUE INDEX
Summary.
Long description.
Structure.
Chart graphic.
323Reviews
Kantata
Kantata
Kantata takes professional services automation to a new level, giving people-powered businesses the clarity, control, and confidence they need to optimize resource planning and elevate operational performance. Our purpose-built cloud software is helping over 2,000 professional services organizations in more than 100 countries focus and optimize their most important asset: their people. By leveraging the Kantata Industry Cloud for Professional Services™, professionals gain access to the information and tools they need to win more business, ensure the right people are always available at the right time, and delight clients with project delivery and outcomes.
8.5
CX Score
CX
Score
+90
Net Emotional Footprint
Net Emotional
Footprint
86
Value Index
VALUE INDEX
Summary.
Long description.
Structure.
Chart graphic.
58Reviews
Oracle
Oracle Primavera
Primavera offers extreme performance to manage Engineering and Construction work across the Enterprise. Integrating project controls specialties to transform the business and deliver success every time.
7.8
CX Score
CX
Score
+79
Net Emotional Footprint
Net Emotional
Footprint
84
Value Index
VALUE INDEX
Summary.
Long description.
Structure.
Chart graphic.
55Reviews
For the full list of vendors in this space, click here.
Download
Get Instant Access<br>to this Report
Get Instant Access
to this Report
Unlock your first report with just a business email. Register to access our entire library.
© 2025 SoftwareReviews.com. All rights reserved.


Contact Us
Welcome to SoftwareReviews!
Before continuing, please take a moment to review and agree to our policies and indicate your email preferences below:
Please sign in via LinkedIn to access your free .
Signing in also unlocks access to the dynamic version of the Data Quadrant, which plots vendors based on verified user reviews! Customize the Data Quadrant according to the features and sentiments that matter most to you.
Please note: the dynamic version of the Data Quadrant continues to collect data after report publication, and may show new data that will appear in next year's report.
This offer is available until May 31, 2020. These reports are intended for internal strategic use only and are not authorized for redistribution. For permission to reuse content, please contact vendors@softwarereviews.com.


