Emotional Footprint Awards 2024
Systems Management
SoftwareReviews names as Systems Management Emotional Footprint Award Winners.
View Category
Systems Management
Emotional Footprint Awards
SoftwareReviews Emotional Footprint Awards evaluate and rank products based on emotional response ratings from IT and business professionals. Using our Emotional Footprint methodology, we aggregate emotional footprint scores across 26 dimensions of the vendor-client relationship and product effectiveness, creating a powerful indicator of overall user feeling toward the vendor and product.
Emotional Footprint Awards are proudly founded in 100% user review data and are free of traditional “magical” components such as market presence and analyst opinion, which are opaque in nature and may be influenced by vendor pressure, financial or otherwise.
Read The In-Depth Report
See how each vendor stacks up across each of the 26 dimensions and our thorough evaluation of vendor capabilities, product features, and overall satisfaction.
30+ pages

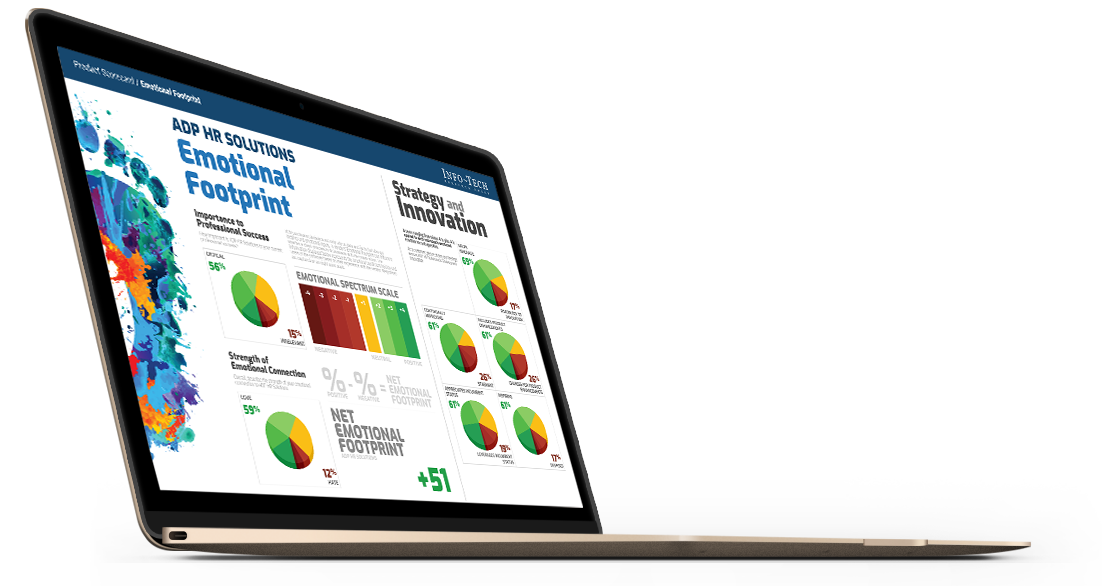
Measuring Emotional Footprint
Emotional Footprint is scored using our “Net Emotional Footprint” Index. This index tracks responses across 26 dimensions of emotional footprint that span 5 categories: Purchasing, Service Experience, Product Impact, Vendor Strategy, and Conflict Resolution. Then, the following calculation is done across this index:
% of Positive Reviews - % of Negative Reviews
For clarity, the total percentage of positive, neutral, and negative ratings is shown for each vendor as well.
Other Evaluated Vendors
Amazon
AWS Systems Manager
AWS Systems Manager is a secure end-to-end management solution for hybrid cloud environments.
8.7
CX Score
CX
Score
+95
Net Emotional Footprint
Net Emotional
Footprint
90
Value Index
VALUE INDEX
IBM
IBM Power Systems
IBM Power Systems for your hybrid multicloud strategy. Get the answers to six of the most common questions posed by IBM Power Systems clients—from AI and disaster recovery to what Red Hat OpenShift and IBM Cloud Paks means for AIX and IBM i clients.
8.6
CX Score
CX
Score
+93
Net Emotional Footprint
Net Emotional
Footprint
91
Value Index
VALUE INDEX
Datadog
Datadog
Datadog is a monitoring service for hybrid cloud applications, assisting organizations in improving agility, increasing efficiency, and providing end-to-end visibility across the application and organization.
8.4
CX Score
CX
Score
+90
Net Emotional Footprint
Net Emotional
Footprint
88
Value Index
VALUE INDEX
ServiceNow
ServiceNow IT Operations Management
Move IT operations from a reactive team to one that works intelligently for the business. Gain visibility across infrastructure and apps, maintain service health, and optimize cloud delivery and spend. Deliver high-performance business services with visibility and AIOps.
8.3
CX Score
CX
Score
+92
Net Emotional Footprint
Net Emotional
Footprint
87
Value Index
VALUE INDEX
Kaseya
Kaseya VSA
Deliver higher service quality and achieve greater IT efficiency with Kaseya VSA, offering remote monitoring and management for all IT functions integrated in a single console.
8.1
CX Score
CX
Score
+87
Net Emotional Footprint
Net Emotional
Footprint
85
Value Index
VALUE INDEX
Oracle
Oracle Enterprise Manager
Oracle Enterprise Manager provides a – single pane of glass – that allows you to manage on-premises and cloud-based IT using the same familiar interface you know and use on-premises every day.
7.8
CX Score
CX
Score
+85
Net Emotional Footprint
Net Emotional
Footprint
84
Value Index
VALUE INDEX
SolarWinds
SolarWinds Server & Application Monitor
SolarWinds Server & Application Monitor (SAM) is designed to monitor your applications and their supporting infrastructure, whether running on-premises, in the cloud, or in a hybrid environment. Don’t let slow applications and downtime impact your end users and business services. Pinpoint the root cause of application issues across various layers of the IT stack.
7.8
CX Score
CX
Score
+93
Net Emotional Footprint
Net Emotional
Footprint
84
Value Index
VALUE INDEX
Microsoft Corporation
Microsoft System Center
System Center helps customers gain an unified datacenter management experience with out-of-the-box monitoring, provisioning, configuration, automation, protection and self-service capabilities. You can now extend System Center capabilities with Microsoft Operations Management Suite (OMS) to deliver a cloud-inspired, platform-agnostic solution to help you manage both traditional infrastructure and modern applications with ease.
7.6
CX Score
CX
Score
+77
Net Emotional Footprint
Net Emotional
Footprint
88
Value Index
VALUE INDEX
For the full list of vendors in this space, click here.
Get Instant Access<br>to this Report
Get Instant Access
to this Report
Unlock your first report with just a business email. Register to access our entire library.
© 2025 SoftwareReviews.com. All rights reserved.