Home > Test Management
Emotional Footprint Awards 2025
Test Management
SoftwareReviews names Azure DevOps and Selenium as Test Management Emotional Footprint Award Winners.
View Category
Test Management
Emotional Footprint Awards
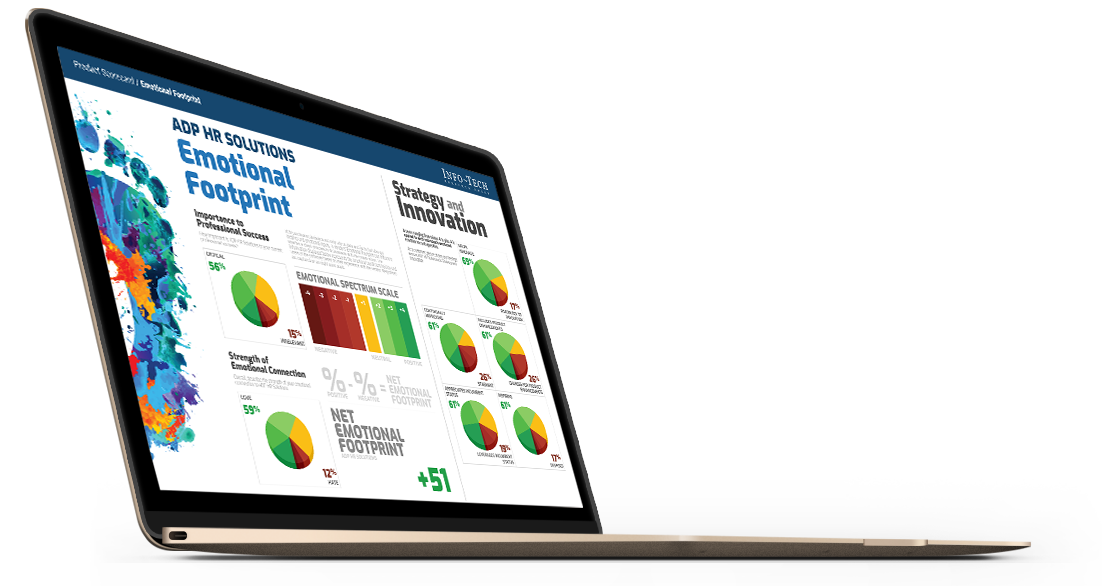
SoftwareReviews Emotional Footprint Awards evaluate and rank products based on emotional response ratings from IT and business professionals. Using our Emotional Footprint methodology, we aggregate emotional footprint scores across 26 dimensions of the vendor-client relationship and product effectiveness, creating a powerful indicator of overall user feeling toward the vendor and product.
Emotional Footprint Awards are proudly founded in 100% user review data and are free of traditional “magical” components such as market presence and analyst opinion, which are opaque in nature and may be influenced by vendor pressure, financial or otherwise.
Read The In-Depth Report
See how each vendor stacks up across each of the 26 dimensions and our thorough evaluation of vendor capabilities, product features, and overall satisfaction.
30+ pages


Measuring Emotional Footprint
Emotional Footprint is scored using our “Net Emotional Footprint” Index. This index tracks responses across 26 dimensions of emotional footprint that span 5 categories: Purchasing, Service Experience, Product Impact, Vendor Strategy, and Conflict Resolution. Then, the following calculation is done across this index:
% of Positive Reviews - % of Negative Reviews
For clarity, the total percentage of positive, neutral, and negative ratings is shown for each vendor as well.
Emotional Footprint Leaders
Selenium
Selenium
Selenium automates browsers. That's it! What you do with that power is entirely up to you. Primarily it is for automating web applications for testing purposes, but is certainly not limited to just that. Boring web-based administration tasks can (and should) also be automated as well.
9.1
CX Score
CX
Score
+93
Net Emotional Footprint
Net Emotional
Footprint
86
Value Index
VALUE INDEX
Summary.
Long description.
Structure.
Chart graphic.

144Reviews
Microsoft Corporation
Azure DevOps
Plan smarter, collaborate better and ship faster with Azure DevOps Services, formerly known as Visual Studio Team Services.
9.1
CX Score
CX
Score
+91
Net Emotional Footprint
Net Emotional
Footprint
88
Value Index
VALUE INDEX
Summary.
Long description.
Structure.
Chart graphic.

197Reviews
Other Evaluated Vendors
Postman
Postman
Postman is your single platform for collaborative API development. Join 35+ million devs building great APIs together, across the entire API lifecycle.
8.6
CX Score
CX
Score
+93
Net Emotional Footprint
Net Emotional
Footprint
88
Value Index
VALUE INDEX
Summary.
Long description.
Structure.
Chart graphic.
22Reviews
SmartBear Software
CucumberStudio
Behavior-Driven Development is revolutionizing how organizations build software. CucumberStudio gives your team the platform to succeed with BDD. It's a single source of truth for BDD development your whole team will love.
8.4
CX Score
CX
Score
+97
Net Emotional Footprint
Net Emotional
Footprint
86
Value Index
VALUE INDEX
Summary.
Long description.
Structure.
Chart graphic.
19Reviews
Appium
Appium
Appium is an open source test automation framework for use with native, hybrid and mobile web apps. It drives iOS, Android, and Windows apps using the WebDriver protocol.
8.4
CX Score
CX
Score
+90
Net Emotional Footprint
Net Emotional
Footprint
89
Value Index
VALUE INDEX
Summary.
Long description.
Structure.
Chart graphic.
36Reviews
OpenText Corporation
OpenText Software Delivery Management
OpenText™ ALM Octane includes integrated planning, continuous integration, test management, and release management. With these capabilities, Agile teams and DevOps toolchains deliver high-quality software with insight, traceability, analytics-focused end-to-end visibility, and continuous quality.
8.3
CX Score
CX
Score
+97
Net Emotional Footprint
Net Emotional
Footprint
85
Value Index
VALUE INDEX
Summary.
Long description.
Structure.
Chart graphic.
44Reviews
SmartBear Software
TestComplete
Scale your automated testing efforts and maximize test coverage with the powerful capabilities of TestComplete.
8.2
CX Score
CX
Score
+93
Net Emotional Footprint
Net Emotional
Footprint
82
Value Index
VALUE INDEX
Summary.
Long description.
Structure.
Chart graphic.
24Reviews
Idera Software
TestRail
A complete web-based test case management solution to efficiently manage, track, and organize your software testing efforts.
8.2
CX Score
CX
Score
+91
Net Emotional Footprint
Net Emotional
Footprint
82
Value Index
VALUE INDEX
Summary.
Long description.
Structure.
Chart graphic.
39Reviews
Inflectra
Inflectra SpiraTeam
Inflectra offers a complete ALM solution. Why only address part of the lifecycle? SpiraTeam has the entire process covered, from requirements, testing, tasks, code, builds and bug-tracking all integrated. Therefore, take control of your project's development and software testing.
8.1
CX Score
CX
Score
+93
Net Emotional Footprint
Net Emotional
Footprint
85
Value Index
VALUE INDEX
Summary.
Long description.
Structure.
Chart graphic.
42Reviews
PractiTest
PractiTest
PractiTest is an end-to-end SaaS test management platform that enables you to manage all your QA efforts in one place. With PractiTest you can visualize your data to extract valuable actionable insights and collaborate with all teams to reach business goals.
8.0
CX Score
CX
Score
+89
Net Emotional Footprint
Net Emotional
Footprint
83
Value Index
VALUE INDEX
Summary.
Long description.
Structure.
Chart graphic.
22Reviews
Tricentis
Tricentis Tosca
Tricentis Tosca, the #1 Continuous Testing platform, accelerates testing with a script-less, no-code approach for end-to-end test automation. With support for over 160+ technologies and enterprise applications, Tosca provides resilient test automation for any use case.
7.8
CX Score
CX
Score
+89
Net Emotional Footprint
Net Emotional
Footprint
84
Value Index
VALUE INDEX
Summary.
Long description.
Structure.
Chart graphic.
35Reviews
Parasoft
Parasoft DTP
Parasoft’s suite of automated software testing tools integrates quality into the software delivery process for early prevention, detection, and remediation of defects. The continuous quality suite covers static code analysis, unit testing and code coverage, API testing and service virtualization, and UI testing enabling delivery at speed and compliance with industry and security standards.
7.4
CX Score
CX
Score
+86
Net Emotional Footprint
Net Emotional
Footprint
82
Value Index
VALUE INDEX
Summary.
Long description.
Structure.
Chart graphic.
56Reviews
IBM
IBM Engineering Test Management
IBM® Engineering Test Management (formerly RQM) offers comprehensive test planning, test construction, and test artifact management throughout the development lifecycle. It enables teams to meet their software quality goals and improve efficiency and accuracy in a continuous delivery environment.
7.4
CX Score
CX
Score
+83
Net Emotional Footprint
Net Emotional
Footprint
82
Value Index
VALUE INDEX
Summary.
Long description.
Structure.
Chart graphic.
20Reviews
SmartBear Software
Zephyr
Software Testing As Agile As You Need It to Be Spend less time testing and more time building. From agile development to predictive analytics, you'll achieve full Continuous Testing Agility.
7.0
CX Score
CX
Score
+76
Net Emotional Footprint
Net Emotional
Footprint
79
Value Index
VALUE INDEX
Summary.
Long description.
Structure.
Chart graphic.
23Reviews
For the full list of vendors in this space, click here.
Download
Get Instant Access<br>to this Report
Get Instant Access
to this Report
Unlock your first report with just a business email. Register to access our entire library.
© 2025 SoftwareReviews.com. All rights reserved.


Contact Us
Welcome to SoftwareReviews!
Before continuing, please take a moment to review and agree to our policies and indicate your email preferences below:
Please sign in via LinkedIn to access your free .
Signing in also unlocks access to the dynamic version of the Data Quadrant, which plots vendors based on verified user reviews! Customize the Data Quadrant according to the features and sentiments that matter most to you.
Please note: the dynamic version of the Data Quadrant continues to collect data after report publication, and may show new data that will appear in next year's report.
This offer is available until May 31, 2020. These reports are intended for internal strategic use only and are not authorized for redistribution. For permission to reuse content, please contact vendors@softwarereviews.com.


