Emotional Footprint Awards 2025
Enterprise Performance Management
SoftwareReviews names OneStream, Board, Acterys, and Planful FP&A as Enterprise Performance Management Emotional Footprint Award Winners.
View Category
Enterprise Performance Management
Emotional Footprint Awards
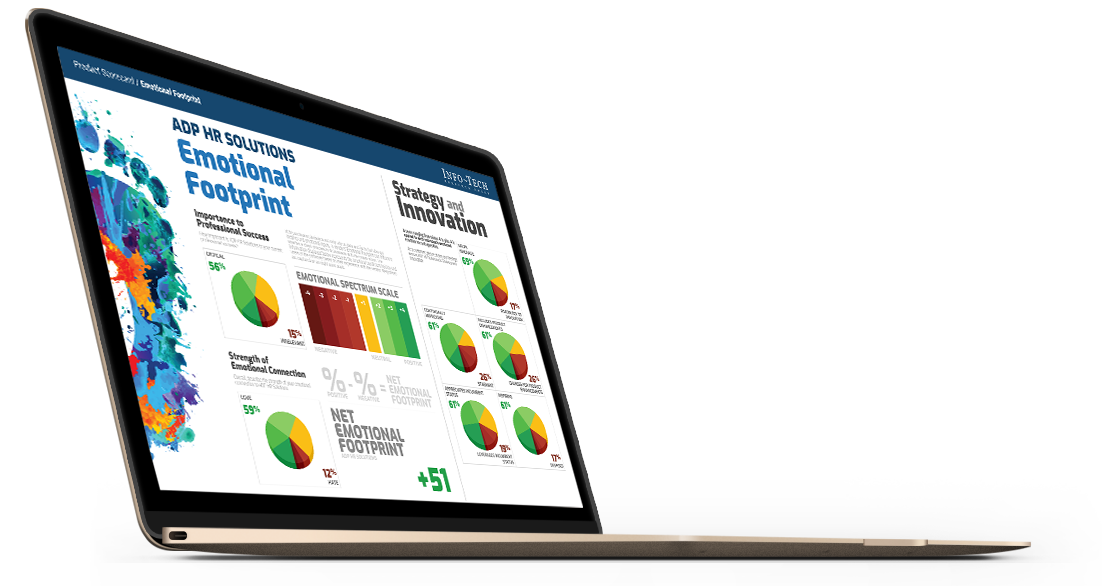
SoftwareReviews Emotional Footprint Awards evaluate and rank products based on emotional response ratings from IT and business professionals. Using our Emotional Footprint methodology, we aggregate emotional footprint scores across 26 dimensions of the vendor-client relationship and product effectiveness, creating a powerful indicator of overall user feeling toward the vendor and product.
Emotional Footprint Awards are proudly founded in 100% user review data and are free of traditional “magical” components such as market presence and analyst opinion, which are opaque in nature and may be influenced by vendor pressure, financial or otherwise.
Read The In-Depth Report
See how each vendor stacks up across each of the 26 dimensions and our thorough evaluation of vendor capabilities, product features, and overall satisfaction.
30+ pages


Measuring Emotional Footprint
Emotional Footprint is scored using our “Net Emotional Footprint” Index. This index tracks responses across 26 dimensions of emotional footprint that span 5 categories: Purchasing, Service Experience, Product Impact, Vendor Strategy, and Conflict Resolution. Then, the following calculation is done across this index:
% of Positive Reviews - % of Negative Reviews
For clarity, the total percentage of positive, neutral, and negative ratings is shown for each vendor as well.
Emotional Footprint Leaders
Board International
Board
The Board Enterprise Planning Platform powers financial and operational planning for more than 2,000 organizations worldwide. Industry leaders trust Board to turn complex data into better decisions with AI, analytics, and tailor-made solutions for enterprise-grade challenges. Global brands including H&M, BASF, Burberry, Toyota, Coca-Cola, General Mills, and HSBC use Board to enhance workflows and strengthen their competitive edge. Founded in 1994, and now with 25 offices worldwide, Board is recognized by leading analysts including BARC, Gartner, and IDC. Visit www.board.com
8.9
CX Score
CX
Score
+94
Net Emotional Footprint
Net Emotional
Footprint
88
Value Index
VALUE INDEX
Summary.
Long description.
Structure.
Chart graphic.

45Reviews
OneStream Software LLC
OneStream
OneStream provides an intelligent finance platform built to enable confident decision-making and maximize business impact. OneStream empowers Finance and Operations teams with insights to make faster and more informed decisions every single day. We unleash organizational value by unifying data management, planning, reporting, analytics, financial close and consolidation. All through a single, modern corporate performance management (CPM) platform designed to continually evolve and scale with your organization.
8.9
CX Score
CX
Score
+93
Net Emotional Footprint
Net Emotional
Footprint
90
Value Index
VALUE INDEX
Summary.
Long description.
Structure.
Chart graphic.

68Reviews
Acterys
Acterys
Acterys (https://www.acterys.com) is a unified platform for analytical applications suited for financial reporting, consolidation and planning solutions integrated with Power BI & Excel. The solution enables you to create professional data models and link data from any source with either the generic Cube Wizard or connectors to a variety of ERP/accounting and SaaS systems.
8.5
CX Score
CX
Score
+93
Net Emotional Footprint
Net Emotional
Footprint
90
Value Index
VALUE INDEX
Summary.
Long description.
Structure.
Chart graphic.

37Reviews
Planful, Inc.
Planful FP&A
Planful is the leader in cloud-based financial applications for planning, consolidation, reporting, analytics and workforce planning.
8.5
CX Score
CX
Score
+95
Net Emotional Footprint
Net Emotional
Footprint
88
Value Index
VALUE INDEX
Summary.
Long description.
Structure.
Chart graphic.

22Reviews
Other Evaluated Vendors
Workday, Inc.
Workday Adaptive Planning
Manage your expenses, budgets, capital, revenue, and workforce. Streamline your financial close. Manage profitability. Our cloud-based business performance management solutions deliver planning, forecasting, reporting, and dashboards for insight across your organization.
8.2
CX Score
CX
Score
+94
Net Emotional Footprint
Net Emotional
Footprint
93
Value Index
VALUE INDEX
Summary.
Long description.
Structure.
Chart graphic.
38Reviews
Vena Solutions Inc
Vena Complete Planning
Vena Complete Planning enables you to work the way you think. Power your Plan To Grow with the flexibility of Excel and the structure of a controlled application environment in a single unified platform. With an Excel interface and OLAP cube technology, Vena is the only cloud-based solution that seamlessly integrates and secures your data.
8.1
CX Score
CX
Score
+88
Net Emotional Footprint
Net Emotional
Footprint
86
Value Index
VALUE INDEX
Summary.
Long description.
Structure.
Chart graphic.
34Reviews
Oracle
Oracle Fusion Cloud EPM
Gain the agility and insights you need to outperform in any market condition. Oracle Fusion Cloud Enterprise Performance Management (EPM) helps you model and plan across finance, HR, supply chain, and sales, streamline the financial close process, and drive better decisions.
8.0
CX Score
CX
Score
+90
Net Emotional Footprint
Net Emotional
Footprint
82
Value Index
VALUE INDEX
Summary.
Long description.
Structure.
Chart graphic.
29Reviews
Anaplan
Anaplan Platform
The Anaplan Platform will help you build a platform built for Connected Planning. Designed to help companies succeed at scale, Anaplan’s cloud-native solution connects people, data, and plans across the enterprise, bringing complex scenario modeling, automated data analysis, and advanced Machine Learning capabilities to drive growth and give businesses a tremendous competitive advantage.
7.7
CX Score
CX
Score
+78
Net Emotional Footprint
Net Emotional
Footprint
85
Value Index
VALUE INDEX
Summary.
Long description.
Structure.
Chart graphic.
34Reviews
SAP
SAP Analytics Cloud
A single solution for business intelligence and collaborative planning, enhanced with the power of predictive analytics and machine learning technology. SAP Analytics Cloud delivers all the analytics capabilities you need – business intelligence (BI), planning, and predictive analytics – in a single solution. Harness the latest technologies and give everyone in your organization the ability to discover actionable insights in real time.
7.6
CX Score
CX
Score
+88
Net Emotional Footprint
Net Emotional
Footprint
85
Value Index
VALUE INDEX
Summary.
Long description.
Structure.
Chart graphic.
48Reviews
Prophix
Prophix
Your business is evolving. Your systems should evolve too. Achieve your goals more successfully with Prophix’s innovative Corporate Performance Management (CPM) software. Improve profitability and minimize risk when you automate repetitive tasks and focus on what matters. Budget, plan, consolidate and report automatically. Whether in the cloud or on-premise, Prophix supports your future with a platform that flexes to suit your strategic realities, today and tomorrow.
7.6
CX Score
CX
Score
+90
Net Emotional Footprint
Net Emotional
Footprint
83
Value Index
VALUE INDEX
Summary.
Long description.
Structure.
Chart graphic.
41Reviews
IBM
IBM Planning Analytics
IBM Planning Analytics partnered with Watson is a AI-powered, extended planning and analysis solution that integrates, streamlines and scales planning, budgeting and forecasting across every part of the organization, including finance, sales, supply chain, HR, IT, and marketing.
7.3
CX Score
CX
Score
+84
Net Emotional Footprint
Net Emotional
Footprint
82
Value Index
VALUE INDEX
Summary.
Long description.
Structure.
Chart graphic.
32Reviews
For the full list of vendors in this space, click here.
Download
Get Instant Access<br>to this Report
Get Instant Access
to this Report
Unlock your first report with just a business email. Register to access our entire library.
© 2025 SoftwareReviews.com. All rights reserved.


Contact Us
Welcome to SoftwareReviews!
Before continuing, please take a moment to review and agree to our policies and indicate your email preferences below:
Please sign in via LinkedIn to access your free .
Signing in also unlocks access to the dynamic version of the Data Quadrant, which plots vendors based on verified user reviews! Customize the Data Quadrant according to the features and sentiments that matter most to you.
Please note: the dynamic version of the Data Quadrant continues to collect data after report publication, and may show new data that will appear in next year's report.
This offer is available until May 31, 2020. These reports are intended for internal strategic use only and are not authorized for redistribution. For permission to reuse content, please contact vendors@softwarereviews.com.


