Emotional Footprint Awards 2023
Application Lifecycle Management
SoftwareReviews names Inflectra SpiraTeam, Azure DevOps, Jama Connect, Digital.ai Agility, and Rally Software as Application Lifecycle Management Emotional Footprint Award Winners.
View Category
Application Lifecycle Management
Emotional Footprint Awards
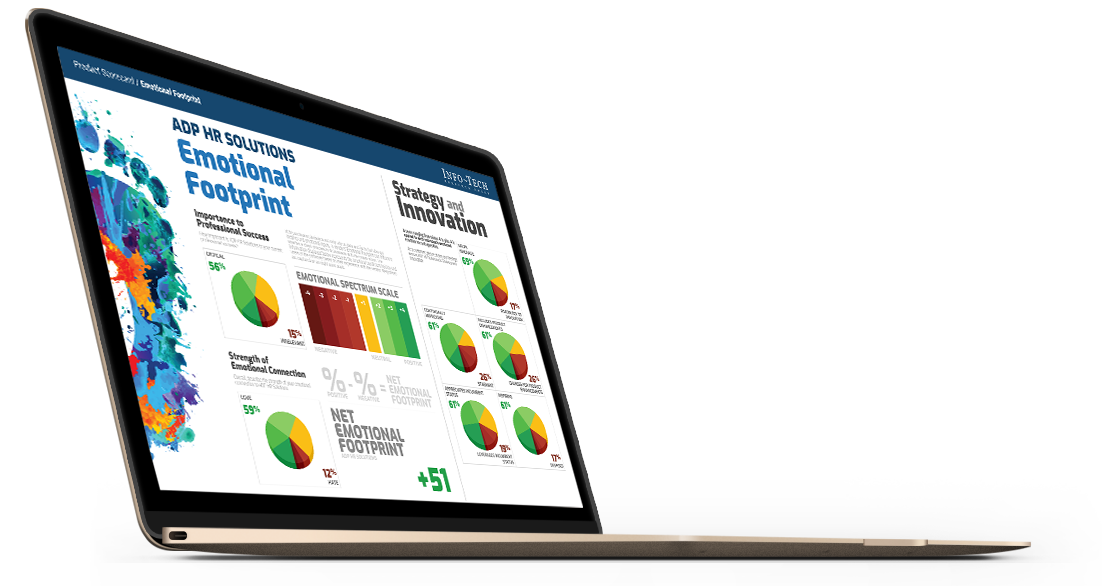
SoftwareReviews Emotional Footprint Awards evaluate and rank products based on emotional response ratings from IT and business professionals. Using our Emotional Footprint methodology, we aggregate emotional footprint scores across 26 dimensions of the vendor-client relationship and product effectiveness, creating a powerful indicator of overall user feeling toward the vendor and product.
Emotional Footprint Awards are proudly founded in 100% user review data and are free of traditional “magical” components such as market presence and analyst opinion, which are opaque in nature and may be influenced by vendor pressure, financial or otherwise.
Read The In-Depth Report
See how each vendor stacks up across each of the 26 dimensions and our thorough evaluation of vendor capabilities, product features, and overall satisfaction.
30+ pages


Measuring Emotional Footprint
Emotional Footprint is scored using our “Net Emotional Footprint” Index. This index tracks responses across 26 dimensions of emotional footprint that span 5 categories: Purchasing, Service Experience, Product Impact, Vendor Strategy, and Conflict Resolution. Then, the following calculation is done across this index:
% of Positive Reviews - % of Negative Reviews
For clarity, the total percentage of positive, neutral, and negative ratings is shown for each vendor as well.
Emotional Footprint Leaders
Inflectra
Inflectra SpiraTeam
Inflectra offers a complete ALM solution. Why only address part of the lifecycle? SpiraTeam has the entire process covered, from requirements, testing, tasks, code, builds and bug-tracking all integrated. Therefore, take control of your project's development and software testing.
9.2
CX Score
CX
Score
+95
Net Emotional Footprint
Net Emotional
Footprint
90
Value Index
VALUE INDEX
Summary.
Long description.
Structure.
Chart graphic.

115Reviews
Microsoft Corporation
Azure DevOps
Plan smarter, collaborate better and ship faster with Azure DevOps Services, formerly known as Visual Studio Team Services.
9.1
CX Score
CX
Score
+93
Net Emotional Footprint
Net Emotional
Footprint
89
Value Index
VALUE INDEX
Summary.
Long description.
Structure.
Chart graphic.

255Reviews
Jama Software Inc
Jama Connect
Jama Software provides the leading platform for requirements, risk and test management, Jama Connect. Companies developing complex products, systems and software, can define, align and execute on what they need to build, reducing lengthy cycle times, minimize effort spent on proving compliance, and wasteful rework. Teams can manage requirements, risk and end-to-end traceability across the lifecycle, with flexibility to support various engineering disciplines and development methodologies.
9.1
CX Score
CX
Score
+96
Net Emotional Footprint
Net Emotional
Footprint
86
Value Index
VALUE INDEX
Summary.
Long description.
Structure.
Chart graphic.

15Reviews
Digital.ai Software Inc
Digital.ai Agility
Digital.ai Agility (formerly VersionOne) is an industry-leading enterprise agile planning solution that drives consistency and efficiency by scaling agile practices across all levels, from teams to the entire product portfolio.
9.1
CX Score
CX
Score
+96
Net Emotional Footprint
Net Emotional
Footprint
85
Value Index
VALUE INDEX
Summary.
Long description.
Structure.
Chart graphic.

26Reviews
Broadcom Inc.
Rally Software
Easily coordinate every phase of your application development lifecycle—with our cutting-edge, continuous insight throughout the process. Our application lifecycle management solutions can get you where you need to go, from planning and development through deployment, management and beyond.
9.0
CX Score
CX
Score
+93
Net Emotional Footprint
Net Emotional
Footprint
86
Value Index
VALUE INDEX
Summary.
Long description.
Structure.
Chart graphic.

43Reviews
Other Evaluated Vendors
Atlassian
Jira
JIRA Software is built for every member of your software team to plan, track, and release great software.
8.7
CX Score
CX
Score
+88
Net Emotional Footprint
Net Emotional
Footprint
87
Value Index
VALUE INDEX
Summary.
Long description.
Structure.
Chart graphic.
260Reviews
Micro Focus
Micro Focus ALM Octane
Micro Focus Application Lifecycle Management (ALM) solutions enable enterprises to deliver high quality applications with greater speed, agility and control. Micro Focus ALM solutions combine enterprise proven, highly integrated, technology agnostic products with an extensive partner eco-system to deliver applications with greater velocity, quality and value. The Micro Focus solution stack includes several award winning products which cover all aspects of application development and delivery.
8.6
CX Score
CX
Score
+89
Net Emotional Footprint
Net Emotional
Footprint
84
Value Index
VALUE INDEX
Summary.
Long description.
Structure.
Chart graphic.
44Reviews
ALM Works
ALM Works Structure
Structure for Jira helps Atlassian's largest customers visualize, track and manage progress across Jira projects and teams. It does this with adaptable, user-defined, issue hierarchies presented in a familiar spreadsheet-like view of Jira issues.
8.6
CX Score
CX
Score
+90
Net Emotional Footprint
Net Emotional
Footprint
82
Value Index
VALUE INDEX
Summary.
Long description.
Structure.
Chart graphic.
43Reviews
Perforce Software, Inc.
Helix ALM
Manage all product development phases and artifacts—from requirements and user stories through QA cycles and deployment—with ONE SOLUTION.
8.4
CX Score
CX
Score
+84
Net Emotional Footprint
Net Emotional
Footprint
85
Value Index
VALUE INDEX
Summary.
Long description.
Structure.
Chart graphic.
37Reviews
Visure
Visure Requirements ALM Platform
Visure is a trusted specialized Requirements ALM partner for companies of all sizes across safety and business-critical industries. Visure offers specialized, innovative and user-friendly platform covering Requirements Management, Risk Management, Test Management, Bug Tracking, Traceability, Reporting and Standard Compliance, aimed to guarantee the highest quality in product development.
7.9
CX Score
CX
Score
+80
Net Emotional Footprint
Net Emotional
Footprint
79
Value Index
VALUE INDEX
Summary.
Long description.
Structure.
Chart graphic.
61Reviews
PTC
Codebeamer
Intland Software's codebeamer is an industry-leading Application Lifecycle Management (ALM) platform for advanced product and software development. Offering all-in-one requirements, risk, and test management capabilities, codebeamer helps simplify complex product and software engineering at scale. This open, enterprise-grade platform extends ALM functionalities with product line configuration capabilities and unique configurability for complex safety-critical development & compliance processes.
7.6
CX Score
CX
Score
+75
Net Emotional Footprint
Net Emotional
Footprint
76
Value Index
VALUE INDEX
Summary.
Long description.
Structure.
Chart graphic.
28Reviews
For the full list of vendors in this space, click here.
Download
Get Instant Access<br>to this Report
Get Instant Access
to this Report
Unlock your first report with just a business email. Register to access our entire library.
© 2025 SoftwareReviews.com. All rights reserved.


Contact Us
Welcome to SoftwareReviews!
Before continuing, please take a moment to review and agree to our policies and indicate your email preferences below:
Please sign in via LinkedIn to access your free .
Signing in also unlocks access to the dynamic version of the Data Quadrant, which plots vendors based on verified user reviews! Customize the Data Quadrant according to the features and sentiments that matter most to you.
Please note: the dynamic version of the Data Quadrant continues to collect data after report publication, and may show new data that will appear in next year's report.
This offer is available until May 31, 2020. These reports are intended for internal strategic use only and are not authorized for redistribution. For permission to reuse content, please contact vendors@softwarereviews.com.


